The B2B Media Sales Manager's Guide to Pipeline Visibility
By David | 9 min read | 20 April 2026
If you are a sales manager at a B2B media company, you have probably sat in a Monday morning meeting and tried to answer a question you should know the answer to: how much revenue is genuinely closable this quarter? Not pipeline fluff, not deals that have been sitting in the same stage for six weeks. Real, closable revenue. And the honest answer is that most sales managers cannot tell you with confidence, because the data is unreliable.
The information exists. It is in the CRM, in email threads, in call notes, in spreadsheets someone built because the CRM was too painful to use. But scattered data is not useful data. Until it is consolidated in one place, in a format a manager can actually interpret at speed, it is just noise. The result is that decisions about pipeline and people get made on gut feel rather than evidence, which is a problem when you are managing a team of 10 or 20 reps selling sponsorship, advertising, and content partnerships into a competitive market.
This is not a technology problem. It is a setup problem. The tools to give a sales manager complete pipeline visibility exist and are not expensive. What most B2B media businesses are missing is a clear-eyed view of where the gaps are and a systematic approach to closing them.
Why Pipeline Visibility Fails in B2B Media Sales Teams
There are three root causes, and they tend to compound each other. The first is that the CRM is not set up to match how the team actually sells. Most implementations are done once, years ago, and the deal stages and fields reflect a generic sales process rather than the specific commercial conversations happening in a media business. Reps find workarounds. They keep their own tracking documents. They stop entering data because the CRM does not reflect their reality, and once that habit sets in it is very difficult to reverse.
The second root cause is that deal stages are too generic to carry meaning. A stage called 'Proposal' could mean a rep has sent a formal document to a decision-maker who has asked for it, or it could mean a rep has emailed a rates card to an intern who will never reply. Both deals sit in the same stage, carrying the same implied probability, distorting every pipeline report the manager tries to read.
The third root cause is the absence of a single, reliable view of the business. Managers end up relying on weekly rep updates, which are optimistic by nature, or running ad hoc reports that take time and produce data that is already stale by the time it is reviewed. There is no dashboard a manager can open on Monday morning that tells them, in two minutes, exactly what the pipeline looks like and where the problems are.
The Deal Stage Problem: Making Your Pipeline Mean Something
A pipeline with stages like Prospect, Qualified, Proposal, and Closed Won is almost useless as a management tool. The stages are too broad, the entry criteria are undefined, and two reps will interpret them differently. One rep marks a deal as Proposal after a conversation where sponsorship was mentioned. Another waits until a written brief has been received and a proposal has been formally requested. The pipeline data becomes meaningless because the inputs are inconsistent.
For a B2B media business selling sponsorship and advertising, the deal stages need to reflect the actual commercial conversation. A sequence that works is: Initial Contact, Brief Received, Proposal Sent, Verbal Agreement, Contract Sent, Closed Won. Each stage needs a clear definition, written down, agreed by the team, and enforced through CRM configuration.
Initial Contact means a relevant conversation has taken place and the prospect has expressed some level of interest. Brief Received means a formal brief or clear buying criteria has been shared by the client. Proposal Sent means a tailored proposal has been sent to a confirmed decision-maker, not a rates card to an unqualified contact. Verbal Agreement means the client has confirmed intent to proceed, price has been discussed and is not a blocker, and paperwork is the remaining step. Contract Sent means the contract is with the client awaiting signature. Closed Won means signed and booked.
These definitions do two things. They make the pipeline data trustworthy, because every rep is operating to the same standard. And they make coaching conversations more productive, because a manager can look at a deal in Proposal Sent that has been sitting there for three weeks and have a specific conversation about what has happened since the proposal went out, rather than a vague discussion about whether the deal is progressing.
What a Useful Dashboard Actually Shows
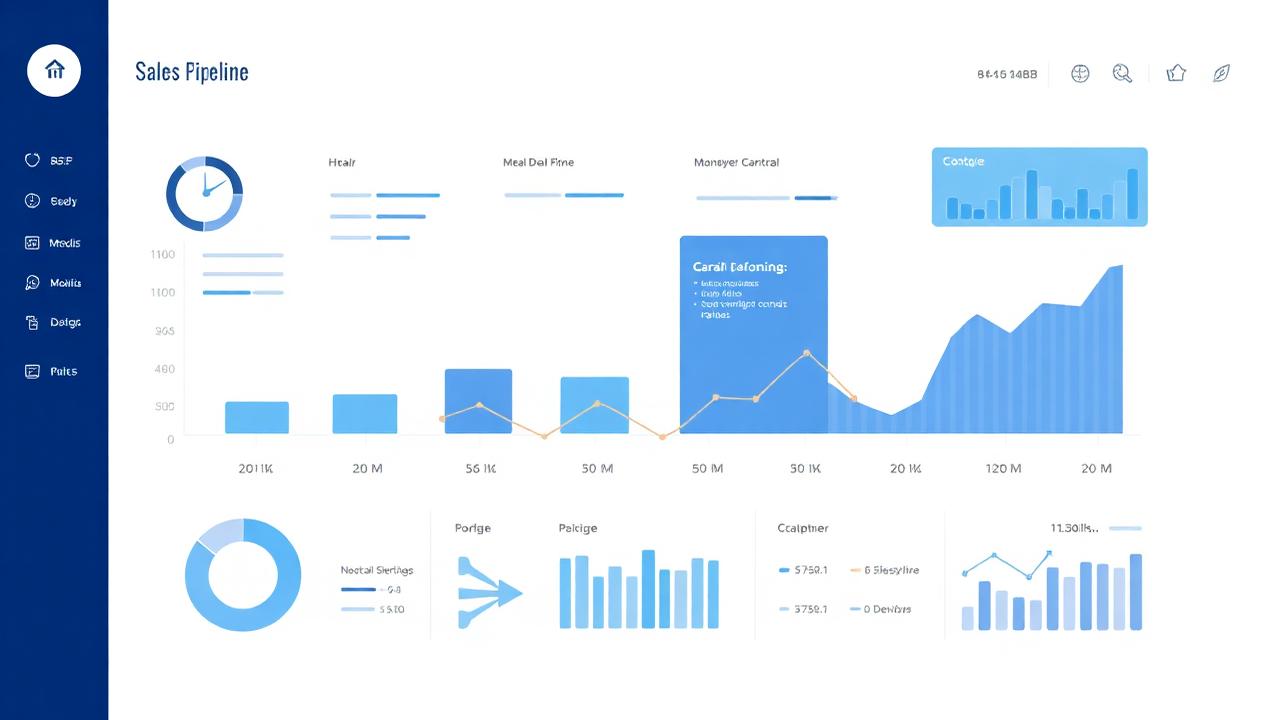
The goal of a pipeline dashboard is not to produce impressive charts. It is to give a manager the information needed to make decisions in the first 30 minutes of a Monday morning. That means cutting every vanity metric and focusing on five views that between them tell a complete story about pipeline health.
The first view is total pipeline value by stage, filtered to the current quarter. This gives an immediate read on whether there is enough revenue in play to hit the number, and where the weight of the pipeline sits. If most of the value is in early stages with the quarter half over, that is a problem that needs addressing this week.
The second view is deals with no activity in the last seven days. This is the danger list. In B2B media sales, deals die through inaction as often as they die through rejection. A deal that has gone quiet is a deal that is probably moving to a competitor or being quietly deprioritised by the client. A manager who can see this list every Monday can intervene before the deal is lost, rather than hearing about it in a pipeline review six weeks later.
The third view is average deal velocity: how long deals take to move between stages, measured across the last rolling quarter. Velocity data tells a manager where deals are getting stuck in the process. If deals are moving quickly from Initial Contact to Proposal Sent but then stalling for weeks before Verbal Agreement, that points to a specific problem in how proposals are being followed up, or how the commercial conversation is being conducted.
The fourth view is conversion rate by stage: what percentage of deals that enter each stage successfully move to the next. This is where you see the shape of the sales funnel in practice rather than in theory. A low conversion rate from Proposal Sent to Verbal Agreement, for example, might indicate that proposals are being sent before the brief has been properly qualified, or that pricing is consistently landing wrong.
The fifth view is rep activity: calls logged, emails sent, and meetings booked per rep, measured against a defined weekly target. Activity is a leading indicator. If a rep has had a quiet week in terms of conversations, next week's pipeline movement will reflect that. A manager who can see activity data on Monday can have the right conversation before the number suffers.
All five of these views are buildable in HubSpot without custom development. The challenge for most teams is not the tool, it is the configuration and the data discipline behind it.
How Fathom and Make Feed Into This
The weakest link in most pipeline setups is activity data. Reps do not log calls consistently. They forget to update notes after a client meeting. They mean to update the CRM stage after a verbal agreement and do not get to it until the following week. The result is that the activity views in any dashboard are always understating what is actually happening, which makes them unreliable as management tools.
Fathom solves the call logging problem. It records and transcribes sales calls, extracts the key points, and syncs the summary directly to the relevant HubSpot contact and deal record. The rep does not have to log anything manually. The data appears in HubSpot automatically, with the right timestamps, attached to the right deal. Activity data goes from being a rough approximation to being an accurate record.
Make handles the automation layer. Where there are clear triggers that should move a deal to a new stage, for example when a contract is sent via DocuSign, Make can push that update to HubSpot without requiring the rep to do it manually. The same logic applies to follow-up task creation: when a proposal is logged as sent, Make can automatically create a follow-up task for the rep three days later. The CRM starts to reflect reality rather than lagging behind it.
The combined effect is that the pipeline dashboard becomes trustworthy. The data is not dependent on rep discipline or memory. It is captured at source and fed into the system automatically, which means the five views a manager needs every Monday are accurate rather than indicative.
Running the Weekly Pipeline Review
With the right dashboard in place, the Monday morning pipeline review changes character. It stops being a rep interrogation where a manager asks for updates on deals and gets optimistic summaries. It becomes a structured 30-minute review of the five metrics, focused on identifying deals that need intervention and assigning clear next actions before the week starts.
The review has a consistent structure. Start with total pipeline value by stage against the quarterly target. If the numbers are broadly on track, spend two minutes on it and move on. If they are not, that frames every subsequent decision. Next, go to the no-activity list. For every deal that has gone quiet, the question is simple: what has happened and what happens next? Either the rep has a plan, or the manager helps them make one, or the deal gets moved to an inactive status so the pipeline reflects reality.
Then look at velocity and conversion data together. This is where patterns become visible. If the same stage is consistently showing slow movement or poor conversion across multiple reps, the problem is likely process or product rather than individual rep performance. That is a different conversation to the one where a single rep has a conversion problem that nobody else shares.
Finish with rep activity. Any rep who has logged significantly below the weekly activity target gets a brief conversation: what happened, and what does this week look like? Keep it factual. The data is neutral. The conversation is about removing blockers, not assigning blame.
Thirty minutes, five views, clear next actions. A manager who runs this consistently goes from reactive to proactive within a quarter. Problems become visible before they become losses. Coaching conversations are grounded in data rather than impression. The pipeline review becomes one of the most useful hours of the week rather than the most uncomfortable.
Where to Start
Pipeline visibility is not a reporting problem. It is a setup problem. Most B2B media sales teams already have HubSpot or a comparable CRM. They already have reps making calls and sending proposals. The data is being generated. The question is whether the system is configured to capture it accurately and surface it in a way a manager can use.
Getting there requires three things: deal stages that reflect how the team actually sells, automation that captures activity data without relying on rep discipline, and a dashboard that presents the five key views clearly and without manual effort. None of that is technically complex. It is primarily a configuration and process problem.
The place to start is an honest audit of your current setup: what is the CRM capturing, what is missing, where are the gaps between the data you have and the data you need? That means reviewing the HubSpot configuration as it stands, mapping how the team actually sells against how the deal stages are set up, listing the automation opportunities, and turning that into an implementation sequence. Most teams have the foundation already. They just need it wired together correctly.
Once the setup is right, the data takes care of itself. Pipeline visibility stops being something a manager has to chase and becomes something the system delivers automatically, every Monday morning, before the week has properly started.
---
About the author: David is the founder of AI Sales Stack. Senior sales leader with 23+ years driving multimillion-pound growth across B2B media and events. Pioneered AI-enabled sales operations at Terrapinn and Clarion Events, integrating tools across prospecting, outreach, CRM automation, and proposal generation to shorten sales cycles and increase conversion. Currently Commercial Director at Ocean Media Group, where his brief includes embedding AI tools across the commercial function. Writes here about what is actually working in AI-enabled B2B sales, and what is being oversold.
Get new writing as it's published
Join the mailing list for the AI Sales Stack Cheat Sheet and new articles.
Get the Cheat SheetGet insights like this in your inbox
New writing goes out by email when it's published.
Related Posts

The B2B Outbound Engine: A Complete Guide for 2026
Most B2B outbound fails because it's badly built, not because cold outreach doesn't work. This is the complete guide: the 5 components, the mistakes, and how to build an engine that generates pipeline.

How Event Companies Use AI to Grow Sponsorship Revenue
Sponsorship sales is the last B2B function to adopt AI. Here are the five specific ways event companies use AI to grow sponsorship revenue, with realistic implementation phases and costs.
Best Multi-Channel Outbound Platforms for B2B Events and Media Businesses
A vendor-neutral ranked list of the multi-channel outbound platforms that genuinely fit B2B events and media businesses. Honest pros, cons, pricing, and which ones to skip.